
The food delivery benchmarks that matter most to a restaurant on Grab are the service bars Grab itself publishes in each market: how many orders you cancel, how many arrive late, how many have a missing or wrong item, how long your store is offline, your rating and your monthly orders. Grab sets figures for these in five of the six markets, and in Singapore it even says how many merchants reach them: it puts 30 to 45% of merchants in its basic tier1 and 30 to 40% below its minimum standards2. Independent figures on order values and market growth exist too, but they describe a market, not your restaurant. Use them as context, with their source and their year.
This guide covers the six markets where Grab runs food delivery: Singapore, Malaysia, Thailand, the Philippines, Vietnam and Indonesia. Every figure below comes with who measured it, where, and when.
What are Grab's own benchmarks for a restaurant?
Each market's Grab help centre has an article on its service programme, and each one, except Indonesia's, lists the monthly bars a restaurant must meet. They are set per market and they change: Singapore's Top Service programme, for example, started on 6 April 20263.
Singapore (Top Service). Grab's table lists three bars, for its basic tier, its "Good Service" tier and its "Top Service" tier. Avoidable cancellations at most 1.50%, 1.0% and 0.5%4. Missing or wrong items 2.5%, 1.0% and 0.8%5. Store offline 30.0%, 5.0% and 2.0%6. Late orders 25.0%, 20.0% and 8.0%7. And at least 1, 20 and 100 completed orders a month8.
Malaysia (Top Service). The same three tiers with Malaysia's own bars: avoidable cancellations 15.00%, 1.00% and 1.00%9; missing or wrong items 15.00%, 1.00% and 1.00%10; store offline 30.00%, 15.00% and 10.00%11; late orders 30.00%, 20.00% and 10.00%12; at least 1, 30 and 150 completed orders a month13; and a rating of 0, 4 and 4.5 stars14.
Thailand (Quality Hero). Three tiers, Gold, Silver and Bronze15, with the bars Grab Thailand publishes in a table. From Bronze to Gold: late orders below 50%, 25% and 10%16; offline below 30%, 15% and 10%17; incorrect orders below 20%, 1% and 1%18; and at least 1, 30 and 200 completed orders a month19.
The Philippines (Quality Hero). One set of bars: a lifetime rating above 4.0 stars from at least 10 ratings20, at least 20 orders in the month21, avoidable cancellations under 1%22, late orders under 27%23, missing or wrong items under 1%24 and store offline under 5%25.
Vietnam (Tạp Dề Vàng, the Golden Apron). A rating of at least 4.2 stars26, at least 60 completed orders a month27, late orders under 25%28, cancellations under 1%29, wrong or missing items under 1%30 and time disconnected under 10%31.
Indonesia (Grab Bintang Lima). Grab Indonesia describes its Bintang Lima collection as the restaurants that keep their performance up32, and names what it looks at, such as preparing orders on time33 and keeping cancellations to a minimum34. Its help centre article publishes no figure.
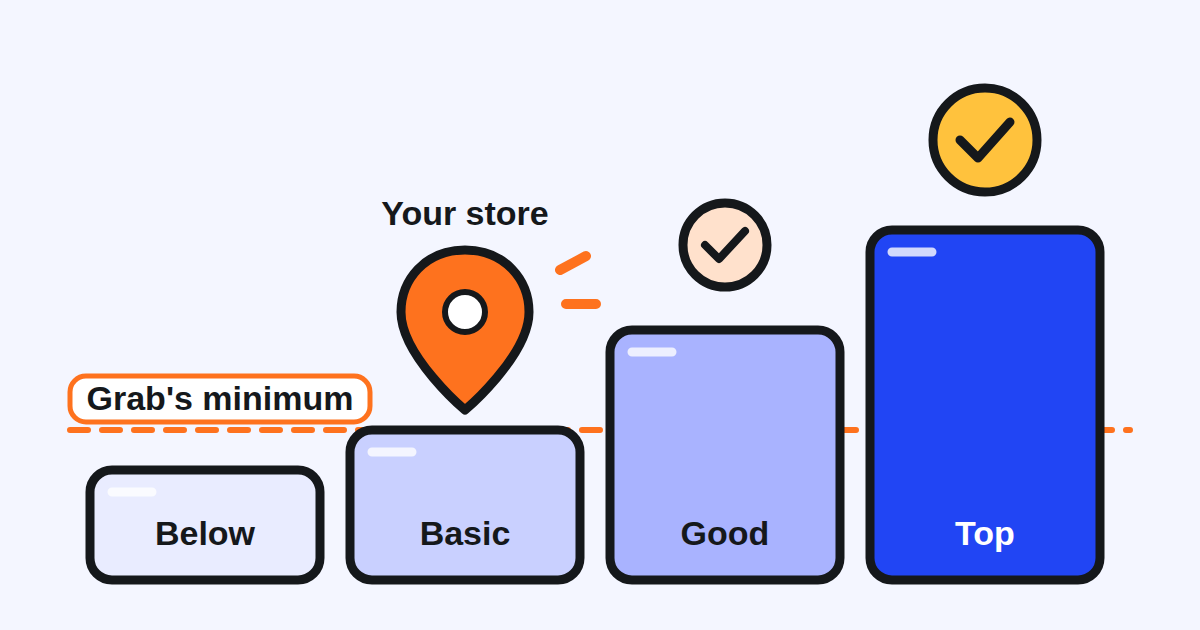
Two things stand out. First, the bars differ a lot from one market to another: the store offline bar for Grab's middle tier is 5.0% in Singapore and 15.00% in Malaysia. A figure that is good in one market can fall short in another, so only your own market's table applies to you. Second, the upper tiers are strict on cancellations and missing items: 1% or less in every market that states them. One cancelled order in a hundred is the line.
What to do: open your market's programme in the GrabMerchant app and note your tier. In Singapore, Grab says the metrics behind the programme are under the Operations tab of Insights35. Write your own figure next to Grab's bar for each measure, and work first on the one furthest from it. If it is the offline rate, Grab Singapore suggests Busy mode rather than a pause, because it slows new orders and reduces both late orders and offline time36.
How many restaurants meet Grab's bar?
Only Grab Singapore says. It puts 30 to 45% of its merchants in the basic tier, the one that meets its minimum requirements1, and 30 to 40% in the tier below, which does not meet its minimum standards2. Read together, Grab estimates that only a minority of Singapore's merchants reach the two tiers with a badge.
That is the most useful published benchmark in this guide. It says where a restaurant stands against the others on the measures Grab uses to reward them. No other market publishes it, so outside Singapore the comparison is with the bar itself.
What is a typical order value on Grab in each market?
The most detailed public figures are old. Measurable AI, a data company that reads food delivery e-receipts from its own consumer panel37, published average order values for Grab in 2021 and 2022:
- Singapore: around US$18 per order in 202138.
- Malaysia: over US$8 throughout 202139.
- For both, the average is the total charged for each order40.
- Thailand: Grab users spent over US$6 per order on average, in data from 2021 to May 202241.
- Indonesia: around US$5.60 per food order, stable for 16 months, in data to March 202242.
- The Philippines: around 615 pesos per order43.
- For Indonesia and the Philippines, the figures rest on the order amount before promotions and discounts44. For Thailand, the page does not say.
No comparable public figure exists for Vietnam in the sources this guide relies on.
Read these with three cautions. They are four to five years old. They measure what customers were charged or ordered, not the food value that reaches your statement. And the panel's size is not published. The direction since then is down, if anything: Momentum Works' report on 2025 found that growth came from more users and more frequent orders, while order values were trending down slightly because platforms pushed affordability45.
What to do: compare your average order with your own figure a year ago, not with a panel's. If it is falling while your orders rise, you are following the market. If both fall, look at your menu and your prices.
How fast is food delivery growing in each market?
Momentum Works' sixth annual report, released in January 2026, estimated that food delivery in Southeast Asia grew 18% in 2025, to US$22.7 billion of gross merchandise value46. Thailand grew fastest, at 22%47. Indonesia, Malaysia and Vietnam grew around 18 to 19%48, Singapore 13%49 and the Philippines 12%50. Grab's share of the region rose from 53.8% in 2024 to about 55% in 202551.
These are estimates of what customers spent on the platforms, not any restaurant's sales. They still give you a useful check. If your orders on Grab stayed flat through 2025 in a market that grew 13 to 22%, the market moved and you did not. That is worth understanding before you change anything else.
What return should you expect from Grab ads?
In a press release of March 26, 202452, Grab Thailand said its self-serve ads yield six times average return on ad spend for merchant partners53, based on Grab internal data in 202354. Grab does not publish how that average is calculated, over which merchants, or how an order is credited to an ad. Treat it as Grab's statement about its merchants as a whole, not as a target for your own campaigns.
What to do: measure your own return. For each campaign, set the orders it brought and what they left you after commission and food cost against what the campaign cost. Compare campaigns with each other, month by month.
Which benchmarks are not published?
Owners often ask how their figures compare on measures no public source answers. In the sources this guide relies on, nobody publishes, for any of the six markets: the share of visitors to a menu who order, the share of customers who come back, the share of orders that carry a promotion, or the average rating of restaurants. If you see one of these quoted without a source, a market and a year, treat it as a guess.
What should you compare each month?
- Each of Grab's service measures against your own market's bar: cancellations, late orders, missing or wrong items, offline time, rating, completed orders.
- Your tier this month against last month's.
- Your average order against the same month last year.
- Your number of orders against the same month last year, and against your market's growth.
- Each ad campaign's orders and what they left you, against what it cost.
Kontimo helps people running restaurants on Grab read these figures each month, against their own market's bars and their own history, explained in plain language.
